

Share this
by Jeremy Spiering on Nov 2, 2026, 12:00:00 PM

Ask a mass tort firm how its week went and you might hear about volume. Calls returned and hours logged. Ask how many claimants got closer to a check, and the room tends to go quiet, because most law firm KPIs never asked that question in the first place. They grew up in hourly practice, where recorded time turns into an invoice every month.
On contingency, that's backwards. The money shows up when a case resolves, and until then the useful question is which files moved this week and what's holding up the rest. Getting it wrong costs real money, even if it's slow to show. A file stuck behind a deficiency notice can look like a productive week on an hourly report right up until its cure deadline passes. A campaign that signs cases cheaply can turn out to be the expensive one once records review starts dropping its signings.
What follows is five numbers built for contingency work, and the one page they belong on every Monday morning. Software helps once the data is clean enough to count. When a claimant's stage is stored as a field on the case rather than in somebody's notes, a reporting tool can add it up for you; when it isn't, no tool will.
What law firm KPIs actually count on contingency
On contingency, the law firm KPIs worth your time are the ones that tell you how fast your claimants are moving toward a check: claimants by stage, fact sheet and discovery compliance, lien resolution days, cost per signed case by campaign, and realization from gross settlement to net fee. Billable hours don't make that list, and we'll get to why.
We'll take them one at a time, with the math for each and the trap to avoid, and at the end there's a one-page weekly report you can copy. We skipped industry benchmarks on purpose. Your own trend line, this week sitting next to last week, will tell you more than somebody else's average.
Why hourly metrics mislead a mass tort or high-volume PI firm
Pick up almost any published list of law firm metrics and you'll find it was written for a firm that bills by the hour. Billable hours per attorney. The share of available hours that actually got billed. Billing realization and collection rate. Every one of them assumes recorded time turns into an invoice on a regular billing cycle. (Our explainer on what legal analytics measures goes through that hourly side, billable hours and realization rates included.)
A contingency firm doesn't work like that. You get paid when the case resolves, which can be years after the client signed, and a mass tort docket can carry hundreds or thousands of claimants in a single litigation. Picture a paralegal who put in long days all week on a file that's stuck behind a deficiency notice. On an hourly dashboard she looks like your most productive person. The file is actually your problem, and the dashboard just hid it.
So the question changes. How much of the inventory moved closer to a check this week, and what stopped the rest? Each KPI below answers a piece of that.
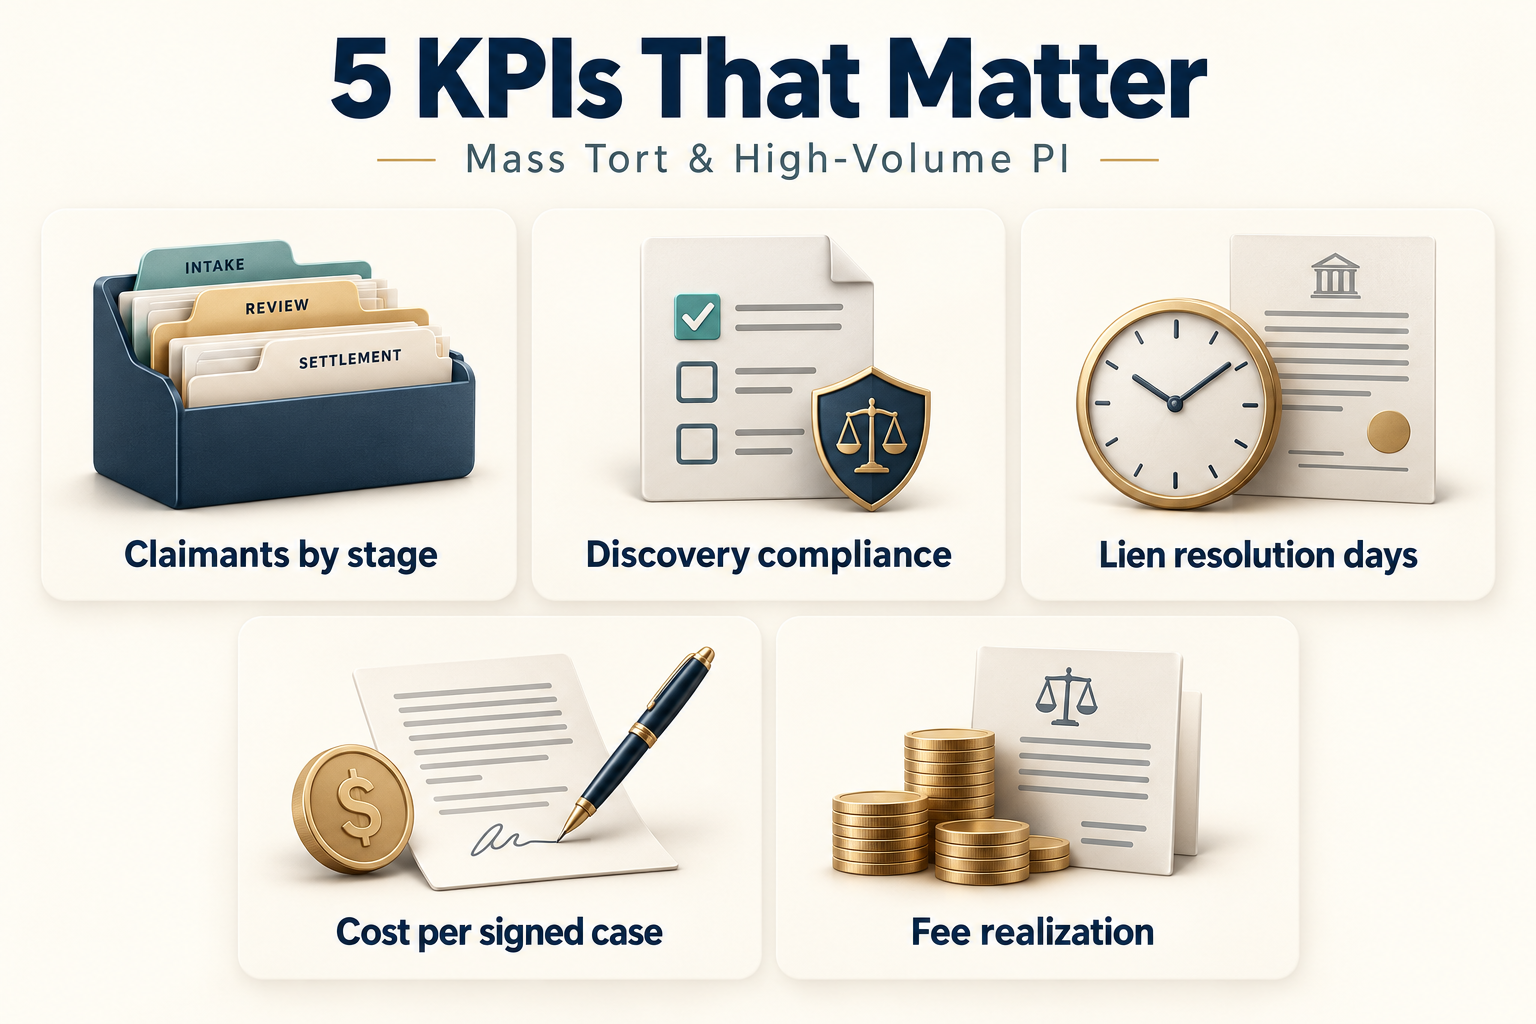
KPI 1: Claimants by stage, signed to disbursed
It's Monday, a little after eight. The managing partner opens the weekly page and goes straight to one row: how many claimants are sitting in "records requested," and how old the oldest of them is. Everything else can wait a minute.
That row is the backbone. To build it, write down the stages your cases really pass through. Something like: signed, records requested, records complete, fact sheet served, deficiency open, settlement-eligible, liens in negotiation, released, disbursed. Then count, every week.
Per stage, you're tracking the count, how many files came in and went out since last week, and how old the oldest file there is.
Why bother? Because stage movement is about as close to a revenue forecast as contingency work gets. A pile that keeps growing in records requested is next year's settlement picture, visible today. A stage that files enter and rarely leave is a bottleneck, and the oldest-file age tells you whether it's getting worse or just sitting there.
The trap is loose definitions. If "records complete" means every provider has responded for one team and "most of them" for another, the count is meaningless. This is where software for mass tort attorneys pays its way: a stage stored as a field on each claimant's case can be counted, and a stage that lives in someone's notes can't. If the inventory itself still needs organizing, start with MDL case management across thousands of claimants.
KPI 2: Fact sheet and discovery compliance rate
Start with the calculation, since it's simple. Take the claimants who had a fact sheet or discovery obligation come due in the period, and ask what percentage were served complete and on time. That's the rate. Next to it, keep a running list of open deficiencies and the number of days left until each one's cure deadline.
Some background. In most MDLs and consolidated proceedings, each plaintiff has a due date to serve a fact sheet, records authorizations and supporting documents. When something is missing, the defense sends a deficiency notice with a window to fix it.
Let that window run out and you can lose the claimant from the inventory. You already paid to sign the case. Now it's gone, and the revenue with it.
So sort the open list by days to cure. Not by the date the notice came in. A firm that works them in the order the notices arrive feels organized. It isn't. For logging and closing each one, see our fact sheet deficiency cure-tracking workflow.
KPI 3: Lien resolution days
Liens sit between a settlement and a disbursement. Medicare, Medicaid, health plans and individual providers each run on their own clock, and the claimant's net payment usually waits until the very last lien is final, which is how a settled case ends up pushing money (and the client's patience) months down the road.
You'll need a start point, and either of two works fine: the day the case became settlement-eligible, or the day the settlement amount was known. Just don't switch halfway through the year. From there it's counting the days on each file until the last lien was confirmed in writing, then reporting the median for files that closed in the period, with the number of open files that have gone past your firm's threshold sitting next to it.
Split that by lienholder type, too. When one category keeps lagging, your staff time (or some outside help) belongs there.
KPI 4: Cost per signed case, by campaign
The uncomfortable part comes first. You can only calculate this by campaign if every case records where it came from at intake. If your intake team captures lead source some of the time, the number won't be reliable, so fix intake first.
Where do your cases come from? For most high-volume PI and mass tort shops it's ads and lead vendors, with referral relationships on top, and this KPI ties that spending to retained clients. The number itself is plain division: everything a campaign cost you during the period (media and lead purchases, plus intake staff time if you allocate it) over the cases that same campaign signed in that same period.
A signature isn't a viable case, though. Some of those files get dropped after records review, others for failing the litigation's injury or product criteria, so put that drop share right beside the cost. Say a firm runs two campaigns and one looks cheaper per signature. If it also sheds the most cases at review, it can be the expensive one per case that survives to settlement.
KPI 5: Realization, gross settlement to net fee
How much of the fee do you actually keep?
In an hourly firm, realization compares billed value with collected value. The contingency version is more useful to you: it compares what the fee agreement says the firm earns on a gross settlement with what the firm walks away with.
So you're dividing the net fee you actually received by the gross fee the contingency agreement calls for, case by case or settlement by settlement. The gap gets eaten by common benefit assessments, fee splits with co-counsel or a referring firm, fee caps, and the case costs you advanced and never got back.
Every one of those deductions comes out of a fee somebody had already planned around. Realization shows how much of the headline fee survives. It also shows which litigations, or which referral relationships, wear it down the most.
The data's already sitting in your files. Every settled case gets a closing statement, and the settlement amount, fee, costs and client remittance on it are your inputs; the KPI is those lines rolled up.
Attorney performance metrics that stay fair at volume
Attorney performance metrics borrowed from hourly practice tend to reward the wrong behavior in a high-volume shop. Hours logged, or how many calls and emails went out. That's effort, and effort isn't the goal. Moving files correctly is.
Push throughput by itself and errors creep up. Come down hard on every mistake and people slow down, and the safest file becomes the one nobody touches. You need both numbers in front of you. Our guide to running a high-volume PI practice covers staffing and workflow.
Throughput and error rate, as a pair
Throughput is simple: how many files a person or team pushed forward at least one stage this week. Error rate is the slice of that work that bounced back. That covers a deficiency notice traced to the team's own submission, a rejected filing, a records request sent to the wrong provider, or a task somebody had to reopen.
Never read one without the other. When throughput is high and errors are climbing, someone's rushing.
And the person with low numbers and a spotless record? She may simply be holding the hardest files on the floor, which makes it a staffing conversation rather than a performance one. Compare people inside the same role and case type. Only there.
The one-page weekly KPI report
One page. The second page is where readers stop. Each of the five KPIs gets its own row showing this week's number and last week's, a four-week trend, and a short note on what changed and whose job the fix is.
|
KPI |
What goes in the row |
Owner
|
|---|---|---|
|
Claimants by stage |
Count per stage, net movement this week, oldest file per stage |
Case managers |
|
Compliance rate |
Percent on time this period; open deficiencies by days to cure |
Discovery lead |
|
Lien resolution days |
Median for files closed; open files past your threshold |
Lien team |
|
Cost per signed case |
By campaign; with drop rate after records review |
Intake / marketing |
|
Realization |
Net fee to gross fee, by settlement closed this period |
Managing partner |
Below the table goes the part people actually discuss in the meeting: what improved, what slipped. Then a last line naming the one decision somebody has to make before next Monday. For what a fuller dashboard should carry, see our piece on what a case management dashboard should show.
Law firm metrics to leave off the page
Track these somewhere if you like. Not here.
- Billable hours. Contingency revenue doesn't come from them.
- Raw lead counts, unless signed and viable cases sit right beside them.
- Total case count with no stage breakdown; a big number can hide an inventory that hasn't moved in weeks.
- Website traffic and call volume. Marketing report.
- Anything nobody acts on. Two months without changing a decision? Drop it.
Getting these numbers in front of partners with CasePacer
Hand-built reports have a shelf life. Somebody rebuilds the spreadsheet every Friday afternoon, then that person goes on vacation, and the report quietly stops. And even when it does get built, it's only as good as the case data underneath. That's the gap legal analytics tools like CP Vantage are there to close.
It's the reporting side of CasePacer. You see how the firm is performing in real time, and nobody has to write code to get there. Want only one attorney's cases? Filter for them. Same with case type, status or jurisdiction, and you can group or search the list too, or build a custom query when the filters don't cover it. Spot something odd in a report and you click straight down into the case behind it. There are ready-made reports for case and status tracking and for dashboard metrics. The financials report pulls in case-related costs such as medical records, expert witnesses and filing fees. You also choose which case metrics show up, so the screen matches how your own team watches performance.
How each of the five KPIs above lands in those reports depends on how your firm records stages, deficiencies, liens and intake data in CasePacer. That's worth working through on a demo, with your own case types on the screen.
Frequently Asked Questions
Which KPIs matter most for a law firm?
Depends how the firm gets paid. Hourly firms lead with billable hours, billing realization and collection rate, while contingency and mass tort firms get more from claimants by stage, compliance, lien resolution days, cost per signed case and realization.
What are attorney performance metrics, exactly?
Measures of an attorney's or team's output and quality. At volume, the fairest attorney performance metrics are throughput (files moved forward a stage) and error rate (work returned as a deficiency, rejection or rework), compared within the same role and case type.
For a contingency fee firm, which law firm key performance indicators count?
Anything tied to how and when a case becomes a fee, from claimants by stage to compliance, lien resolution days and realization. Cost per signed case only counts if the share of cases later dropped is printed right beside it.
Which law firm metrics belong in a mass tort practice?
The five in this guide, reviewed by litigation and in total, since one stalled litigation hides inside a healthy firm-wide number. Add litigation-specific measures like claimants meeting a settlement program's injury criteria, and keep stage definitions strict and identical across teams.
How often should you review your KPIs?
Weekly for claimants by stage, open deficiencies and lien files past threshold. Cost per signed case and realization move slower, so monthly or quarterly is plenty.
Conclusion
Generic law firm KPIs grew up around hourly billing. Your inventory needs its own five, on one page, read every week. Staff judged on throughput and error rate together.
Picture that Monday page again. The managing partner goes straight to the records-requested row and the age of its oldest file, and that one figure says more about next year's settlements than any hours report could. Underneath it, the deficiency list is sorted by days to cure, not by the day each notice showed up, because a cure deadline doesn't care what order the mail came in. Further down, the campaign that looked cheaper per signature might be the one losing the most files at review, and the realization row is built from closing statements already sitting in your files.
None of it holds up if definitions drift between teams. "Records complete" has to mean the same thing for everybody, or the count is noise. A reporting tool like CP Vantage lets you filter by attorney or case type and click down to the case behind an odd number, but it can only count what's stored on the case.
If this week only has room for one task, make it writing down your stage definitions, because everything else on the page depends on them. To see how CasePacer and CP Vantage handle claimant inventories and reporting for mass tort and high-volume PI firms, get a demo.